Specified Transition in NSU3D
Transition Specification
NSU3D includes a facility for user-specified transition locations. The approach is based on specifying regions where the flow is expected to remain laminar. This is enforced by zeroing out the source term in the turbulence model in these user-specified regions using a masking array itmask.
Two methods for specifying transition are provided. The first method relies on defining box regions inside which the turbulence source terms are turned off. The second approach defines laminar regions based on geometry surface patches and a distance from the wall.
Enabling Transition Specification in NSU3D
In order to activate the transition specification option, the optional parameter TRANSITION_SPEC must be specified in the NSU3D input file. The possible values are as follows:
- TRANSITION_SPEC = 0.0 : No transition specification (default)
- TRANSITION_SPEC = 1.0 : Transition specified using box regions and patches with input namelist file
- TRANSITION_SPEC = 2.0 : Old method of transition specification for backward compatibility (not recommended)
An example of an NSU3D input file with transition specification is given below. Note that this input file is used to run the regression test example described below.
NSU3D INPUT FILE: TRANSITION SPECIFICATION REGTEST
RESTARTF  RESTARTT  RNTCYC
0.0        0.0       00.
RESTART FILE
none
MMESH     NTHREAD
1.0       1.0              (1st order = -1)
NCYC      NPRNT     N MESH    MESHLEVEL   CFLMIN    RAMPCYC   TURBFREEZE   FVIS2  FSOLVER_TYPE
25.        0.0         1.        3.0        1.0       0.0       0.           0.      0.0
50.        0.0         3.        2.0        1.0       0.0       0.           0.      0.0
500.       0.0         4.        1.0        1.0       0.0       0.           0.      0.0
CFL       CFLV      ITACC     INVBC     ITWALL    TWALL
1.0        1000.      0.0       0.0       0.0     0.0
VIS 1     VIS 2     H FACTOR  SMOOP     NCYCSM
0.0        20.        0.00    0.00      0.0
C1        C2        C3        C4        C5        C
0.5321    1.3711    2.7744
FIL1      FIL2      FIL3      FIL4      FIL5      FIL6
1.0       1.0       1.0
----------------------------------------------------------------------
COARSE LEVEL AND MULTIGRID PARAMETERS
CFLC      CFLVC     SMOOPC    NSMOOC
1.0       1000.     0.0       0.0
VIS0      MGCYC     SMOOMG    NSMOOMG
4.0       2.        0.8       2.0
----------------------------------------------------------------------
TURBULENCE EQUATION(S)
ITURB     IWALLF    WALLDIST
4.        0.0        1.0
CT1       CT2        CT3      CT4       CT5       CT6
 1.0      1.0        1.0      0.0       0.0
CTC1      CTC2       CTC3     CTC4      CTC5      CTC6
1.0       1.0        1.0      0.0       0.0
VIST0  TSMOOMG   NTSMOOMG
2.0        0.8        2.0
----------------------------------------------------------------------
MACH      Z-ANGLE   Y-ANGLE   RE       RE_LENGTH
0.70       0.00       0.0     3000000.    141.2
----------------------------------------------------------------------
FORCE/MOMENT COEFFICIENT PARAMETERS
REF_AREA  REF_LENGTH XMOMENT  YMOMENT   ZMOMENT  ISPAN
72700.      141.2     504.9    0.0         0.0     2.0
----------------------------------------------------------------------
MESH DATA FILE
../grids/f6wbnc.part.160
----------------------------------------------------------------------
OPTIONAL PARAMETERS (MODIFY FROM DEFAULT VALUES SET IN set_lim_values.f)
PARAMETER NAME                           VALUE(real number with decimal)
IN_SITU_POST_PROC                          1.0
TRANSITION_SPEC                            1.0
Two optional parameters are used in this example. The optional parameter TRANSITION_SPEC is set = 1, which triggers user-specified transition regions. In this mode, NSU3D will attempt to read in a transition specification file called input.transition from the current run directory (same location where the input.nsu3d file is read).
The optional parameter IN_SITU_POST_PROC is also set =1 in this example. In most cases it is important to use the in-situ postprocessing facility to verify that the transition specification is working as expected by visualizing the specified regions and the corresponding masking values (itmask) throughout the flowfield. These are described in more detail in the regression test below.
Transition Specification File: input.transition
The transition specification file defines hexahedral box regions and regions based on surface patches and a corresponding wall distance to identify regions where the masking value itmask is changed (usually set = 0 to remove the turbulence model source terms). The input.transition file used in the accompanying regression test is shown below:
!----------------------------------------------
! Transition Specification Input Namelist File
!----------------------------------------------
&itmask_info
  itmask_default = 1
  nbox_hex       = 2
  nbox_patch     = 1
/
!----------------------------------------------
&itmask_box_hex
itmask    = 0
ipriority = 1
hex       = 26.0, -70.0, 20.0,
            26.0, -70.0, 00.0,
            52.0, -70.0, 00.0,
            52.0, -70.0, 20.0,
            110.0, -239.0, 24.0,
            110.0, -239.0, 20.0,
            161.0, -238.0, 20.0,
            161.0, -238.0, 30.0,
/
!----------------------------------------------
&itmask_box_hex
 itmask    = 0
 ipriority = 2
 hex       = 110.0, -239.0, 24.0,
             110.0, -239.0, 20.0,
             161.0, -238.0, 20.0,
             161.0, -238.0, 30.0,
             291.0, -590.0, 58.0,
             291.0, -590.0, 52.0,
             341.0, -590.0, 52.0,
             341.0, -590.0, 58.0,
/
!----------------------------------------------
&itmask_box_patch
 itmask    = 0
 ipriority = 1
 patch     = 13, 14, 15, 16
 dist      = 8.0
/
!----------------------------------------------
The transition specification file is a Fortran namelist file that contains 3 regions or namelists:
itmask_info : This region sets the overall transition specification parameters.
- itmask_default : This sets the default value for itmask throughout the flow field. Normally this will be =1. If not specified, the value 1 is assumed.
- nbox_hex : The number of hexahedral box regions to be read in. The first nbox_hex entries are read in and any others are ignored.
- nbox_patch : The number of patch-based regions to be read in. Note each patch region can contain multiple patches. The first nbox_patch entries are read in and any others are ignored.
itmask_box_hex : This key word identifies a region that sets the parameters defining a single hexahedral box region.
- itmask : This is the itmask value to apply in this hexahedral box region.
- ipriority : Priority assigned to this region (used for overlapping regions).
- hex : A set of 24 real numbers defining the XYZ coordinates of the 8 vertices of the hexahedral box region. Note these must be in the order depicted in Figure 1, which corresponds to the NSU3D mcell file format and the TECPLOT brick element ordering.
itmask_box_patch : This key word identifies a region that sets the parameters defining a single patch-based region. Note a given patch-based region can contain multiple patches.
- itmask : This is the itmask value to apply in this patch-based region.
- ipriority : Priority assigned to this region (used for overlapping regions).
- patch : A list of surface patches that define the region.
- dist : Defines the extent of the region in terms of the normal distance from the wall or corresponding surface patches. This is given in grid units.
Additional Information:
The transition specification works by assigning an itmask value to each grid point in the flow field. The values are first given the default value specified by itmask_default and then points that fall inside one of the defined hex or patch regions are overwritten with the corresponding itmask values for each region. In the usual mode of operation, the default itmask value is set = 1 and the box regions use the value itmask=0 to prescribe laminar flow regions, such that transition from laminar to turbulent flow occurs near where the itmask values switch from 0 to 1 by giving a high priority overlapping region a value of itmask =1.
A priority value is given to each region which is used for overlapping regions. In regions of overlap, the final itmask value is set according to the box or patch region with the highest priority value. Note that this can also be used to reset the itmask value back to =1 in specific overlap areas.
The list of vertices defining a hexahedral box region must be given in the order defined in Figure 1 below. Although NSU3D does not check for the correct ordering, it does check if the resulting box region has a postive volume and will stop with an error message if the box volume is found to be non-positive.
Each patch region can contain multiple patches. However, a unique itmask, priority and distance value is assigned for each patch region. Multiple patch regions are used to assign different itmask, priority and distance values for different patches.
Consistency Checks:
Consistency checks are performed after reading in the input.transition file as follows: itmask values must all be either =0 or =1. Priority values must be non-zero positive values. Hexahedral defining vertex coordinates must be in the order specified in Figure 1, which corresponds to the ordering used in NSU3D mcell file format and the TECPLOT brick element ordering. NSU3D checks for positive volume hexahedral regions. However this check in itself may not identify all instances of improper vertex ordering. The listed patch numbers are checked to ensure they fall within the range of patch numbers for the given grid. If any of these checks are not passed, NSU3D terminates with a corresponding message.
Mode of Operation:
Upon startup, when the optional parameter TRANSITION_SPEC=1 is detected, NSU3D attemps to read in the additional file input.transition. If the file is not found, execution is terminated with a corresponding message. Conversely, if the file is present it is read in and consistency checks are performed as outlined above. If any of these checks fail execution is terminated with a corresponding message. Next, the itmask values are assigned and a log of the input values is echoed to the standard out file produced by NSU3D. At the same time, the input.transition file is copied to the WRK directory for archiving purposes. An additional file named transition_specification.dat is created and written into the WRK directory. This file contains the definition of the hexahedral box regions, which are written in TECPLOT format in order to be plotted along with output from the in-situ postprocessing facility. In this manner, the extent of the box regions can be verified graphically. Note that the patch-based regions are not included in this file.
In general, the resulting transition specification regions should be checked before they are used to run a CFD simulation. This should include, at a minimum, visualization of the hexahedral box regions plotted alongside the surface geometry, and plotting of the surface itmask values on the geometry. The following regression test illustrates this procedure.
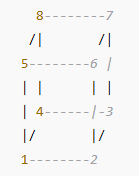
Figure 1: Vertex ordering for hexahedral element definition
Specified Transition Regression Test on DLR-F6
The DLR-F6 test case is used here to illustrate the transition specification capability and how to verify the definition and correctness of the specified transition regions. This case uses the same grid as the baseline DLR-F6 case, which contains approximately 1.2 million points. The conditions for this case are Mach=0.7, Alpha=0.0, Re=3M (based on MAC). The NSU3D input file used for this case is given above. The input.transition file for this case is also shown above, consisting of 2 hexahedral box regions and one patch-based region containing four patches.
In addition, the input.postproc file shown below is used to output specific quantities that are used to verify the transition specification.
!--------------------------------------------------
 !input file for nsu3d post-process
!--------------------------------------------------
&data_def
  frequency = -1   !<--At end only. Note this is the default value if not specified
/
!--------------------------------------------------
&surface_def
  file_name     = 'out_patchall_.szplt'
  outtype       = 'patch'
  bound_def     = 'all'
  varname       = 'itmask, eddy, cp, mach, cf'
/
!--------------------------------------------------
&plane_slice_def
  file_name      = 'slice_circle_.szplt'
  varname        = 'itmask, eddy, cp, mach'
  outtype        = 'field'
  origin(:,1)    = 155.,-130.0,4.7
  origin(:,2)    = 180.,-230.0,18.0
  origin(:,3)    = 226.,-330.0,26.5
  origin(:,4)    = 268.,-430.0,35.0
  origin(:,5)    = 307,-530.0,45.0
  normal(1,:)    =  5*0.0,
  normal(2,:)    =  5*1.0,
  normal(3,:)    =  5*0.0,
  frequency      = -1
!
  bbox(:)       =  5*'circle',
  bbox1(1)      = 95. ,
  bbox1(2)      = 80. ,
  bbox1(3)      = 70. ,
  bbox1(4)      = 60. ,
  bbox1(5)      = 50. ,
/
!--------------------------------------------------
First, a surface output file of outtype=patch is used to produce a TECPLOT file with zones based on all the surface patches of the geometry. Using a patch-based plotting file is most appropriate here as it enables viewing patch-based transition regions. A set of slices are also specified in order to visualize field quantities in addition to surface values. The variables to be visualized are specified as: itmask (turbulence masking variable), eddy (eddy viscosity), cp, mach and cf. Note that the skin friction coefficient cf is a surface-only quantitiy and cannot be visualized on the slices. Naming cf last on the surface guarantees that the other field values can be plotted simulatensously on both the surface and slices.
Running NSU3D with these input files will produce the required output files to reproduce the figures below. To reiterate, the required input files are:
- input.nsu3d
- input.transition
- input.postproc
The relevant output files are:
- std out
- WRK/input.transition (for archival purposes)
- WRK/transition_specification.dat
- WRK/post_proc/out_patchall_000500.szplt
- WRK/post_proc/slice_circle_000500.szplt
The figures below can be reproduced using the supplied layout files in the directory layout_files. This assumes that the tecplot files (*.szplt files) are placed in a directory called post_proc_files on the same level as the directory layout_files. Additionally, the file transition_specification.dat must be copied into the layout_files directory. This file contains the data for plotting the hexahedral box regions for transition specification.
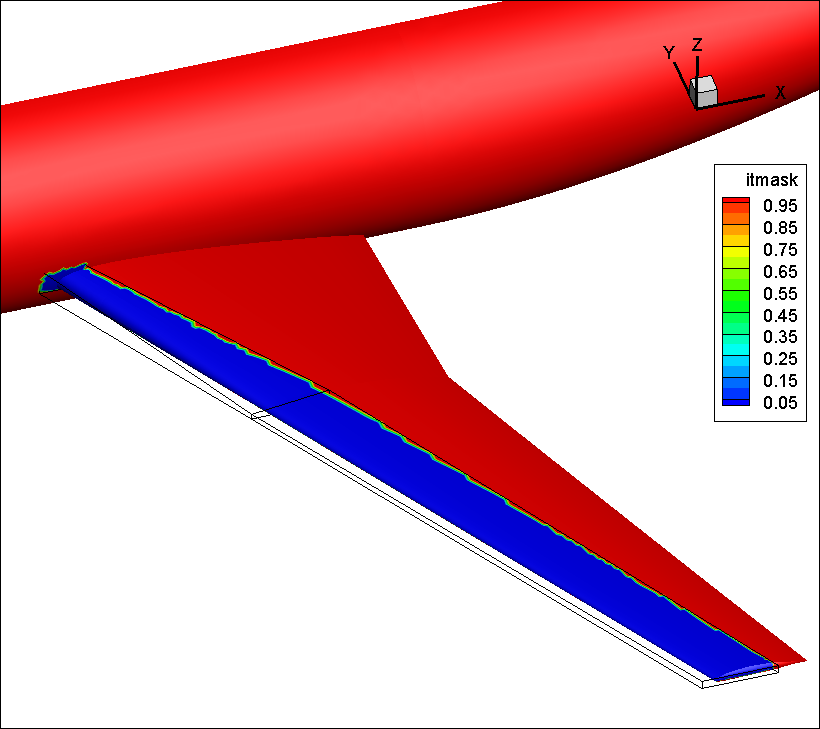
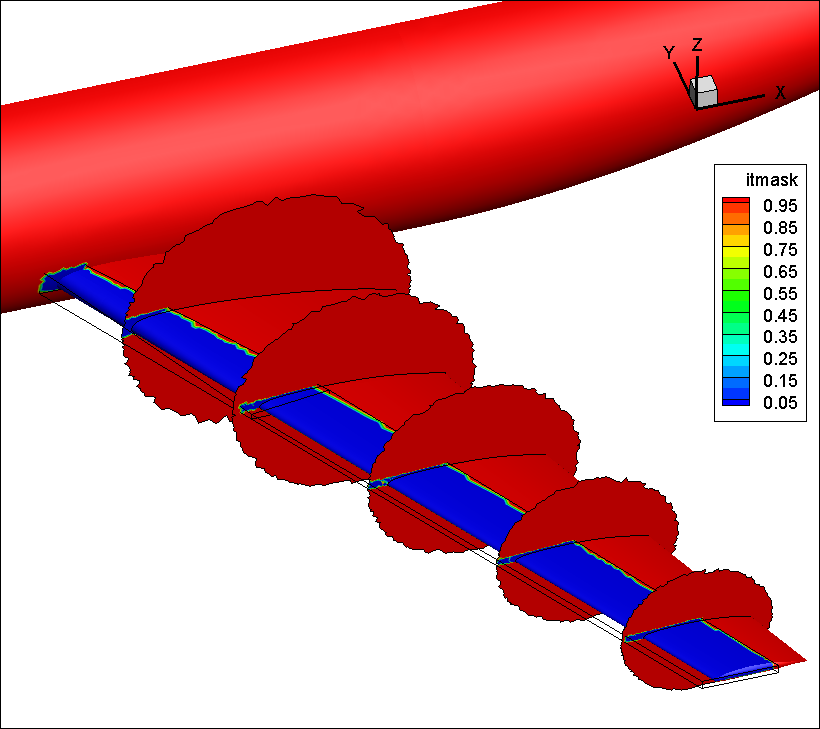
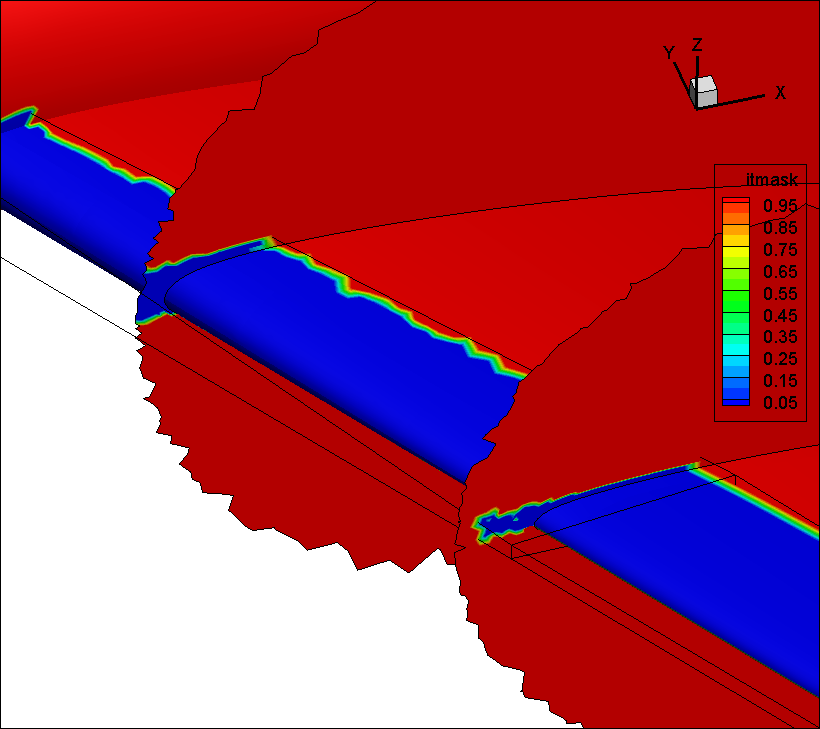
Figure 2: Values of itmask on wing surface (with interior field values on slices) produced by the two specified hexahedral box transition specification regions outlined in wire frame.
Figure 2 illustrates the itmask values produced in the wing region resulting from the specified hexahedral box regions. The two boxes specified in the input.transition file are also shown in the figures. These are obtained by including the transition_specification.dat file output by NSU3D in the plotting data. The first figure shows how the zero itmask values line up on the surface with the projection of the box perimeters. Two boxes are used to negociate the wing geometry near the break section. The box lower surfaces intersect the wing leading edge and thus only limit the itmask values on the upper surface of the wing. The off-surface itmask values can also be seen in the detailed view of the slices, noting the extent of the zero itmask values in the boundary layer regions.
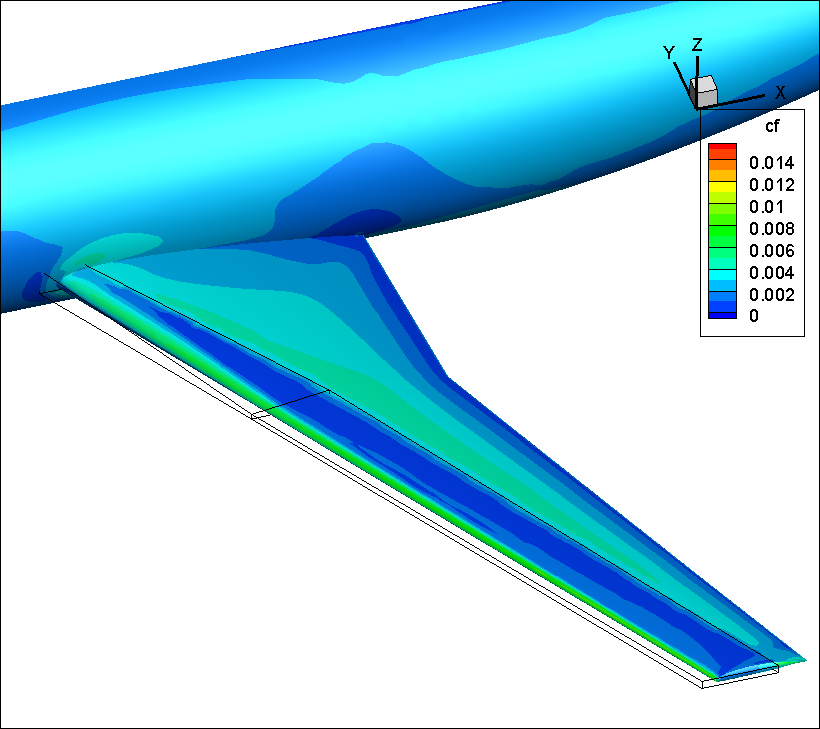
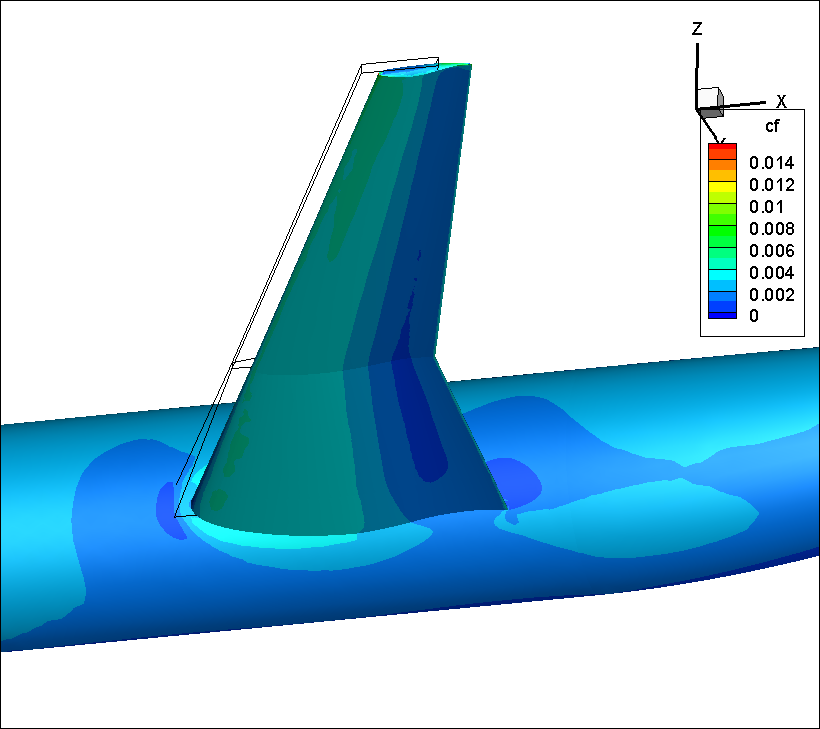
Figure 3: Computed skin friction coefficient on wing upper and lower surfaces illustrating low values in specified hexahedral box regions on wing upper surface.
Figure 3 depicts the computed skin friction values on the wing upper and lower surfaces. On the upper surface, low skin friction values are observed in the box region where laminar flow is expected. On the lower surface, higher skin friction values are observed indicative of turbulent boundary layer flow.
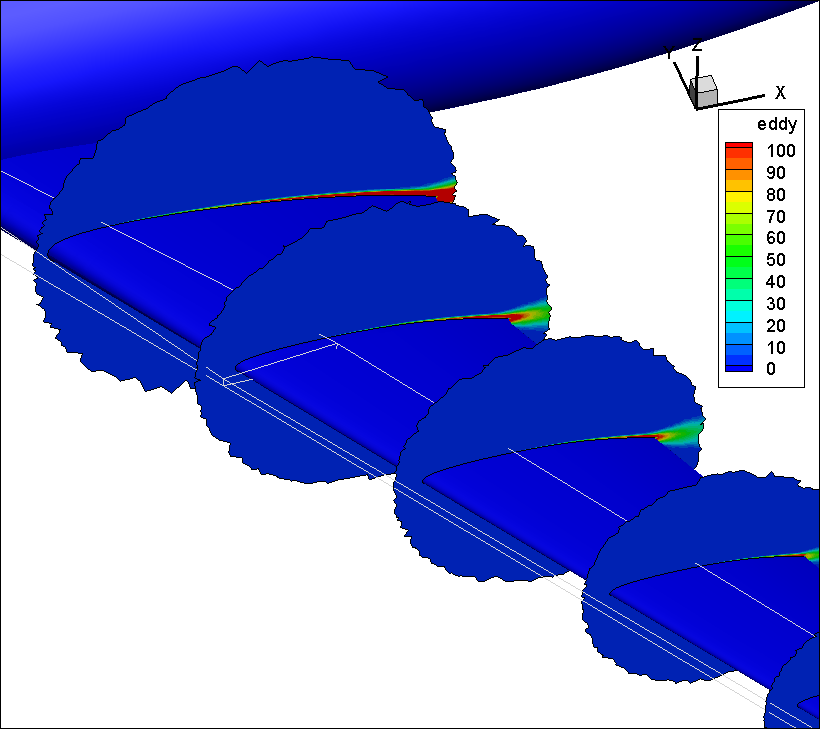
Figure 4: Computed eddy viscosity values in near wing region. regions.
Figure 4 shows contours of eddy viscosity on the wing upper surface, which vanish everywhere on the surface, but grow inside the boundary layer proceeding downstream. The figure shows that the eddy viscosity values are vanishingly small in the hexahedral box regions, where the flow should be laminar, as expected.
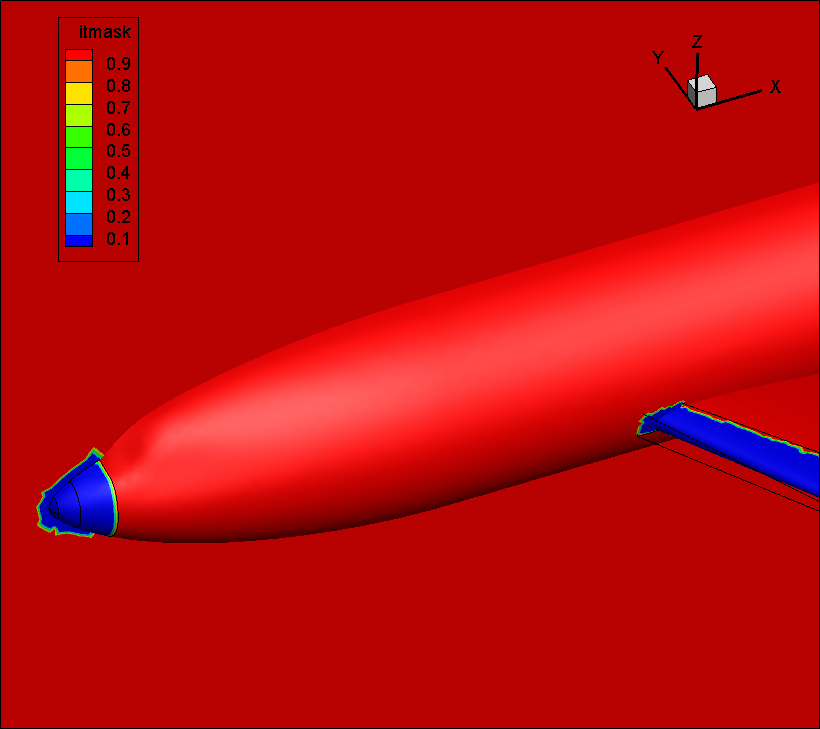
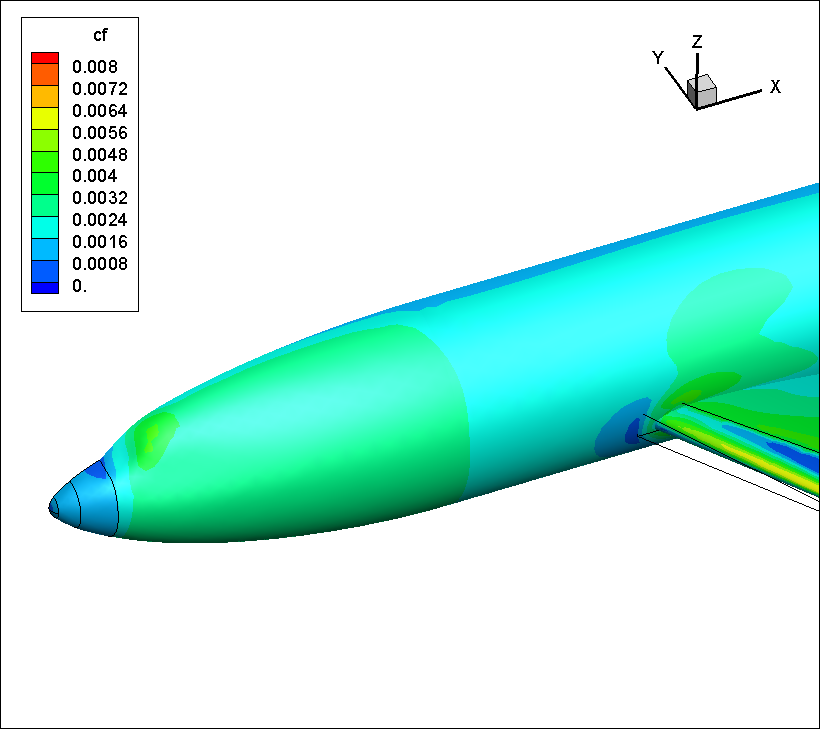
Figure 5: Values of itmask in fuselage nose region defined by patch-based laminar region with distance extent shown on symmetry plane and computed skin friction coefficient in fuselage nose region.
Figure 5 illustrates the specified itmask and computed skin friction values in the fuselage nose region, where the patch-based transition specification takes effect. Here the four patches defining the fuselage nose were specified with a distance of 8.0 in the input.transition file. The resulting itmask values are seen to vanish on the surface and on the symmetry plane up to the specified distance. The computed skin friction plot shows low values on the fuselage nose where the flow is expected to be laminar.